We Simulated Every MLB Season 1,000 Times. October Doesn't Care.
8 seasons. 1,000 simulations each. The World Series champion averaged just 6.9% preseason odds. October baseball is chaos.
Every March, we make the same mistake. We look at rosters, analyze projections, and convince ourselves we can predict October. We can't.
We proved it by running 1,000 Monte Carlo simulations for each MLB season from 2017-2024. Eight seasons, 8,000 simulated universes, full playoff brackets. We wanted to know: if we had perfect season-long data and simulated every possible outcome, how often would we pick the World Series champion?
The answer is humbling. The actual champions averaged just 6.9% preseason probability. Our model's #1 pick won exactly once in eight years. The 2023 Rangers — who actually won it all — had 0.0% odds in our simulations.
October doesn't care about your math.
The Methodology
This wasn't a quick-and-dirty projection. We used Elo ratings — a proven system that accounts for team strength, opponent quality, and home field advantage. For each season, we:
- Started with preseason Elo ratings
- Ran 1,000 full season simulations using real MLB schedules
- Simulated the entire playoff bracket for each universe
- Calculated World Series probabilities for all 30 teams
This is the same core methodology we use for daily game predictions, just applied to an entire season. If our approach works for individual games, it should work for championships, right?
Turns out October had other plans.
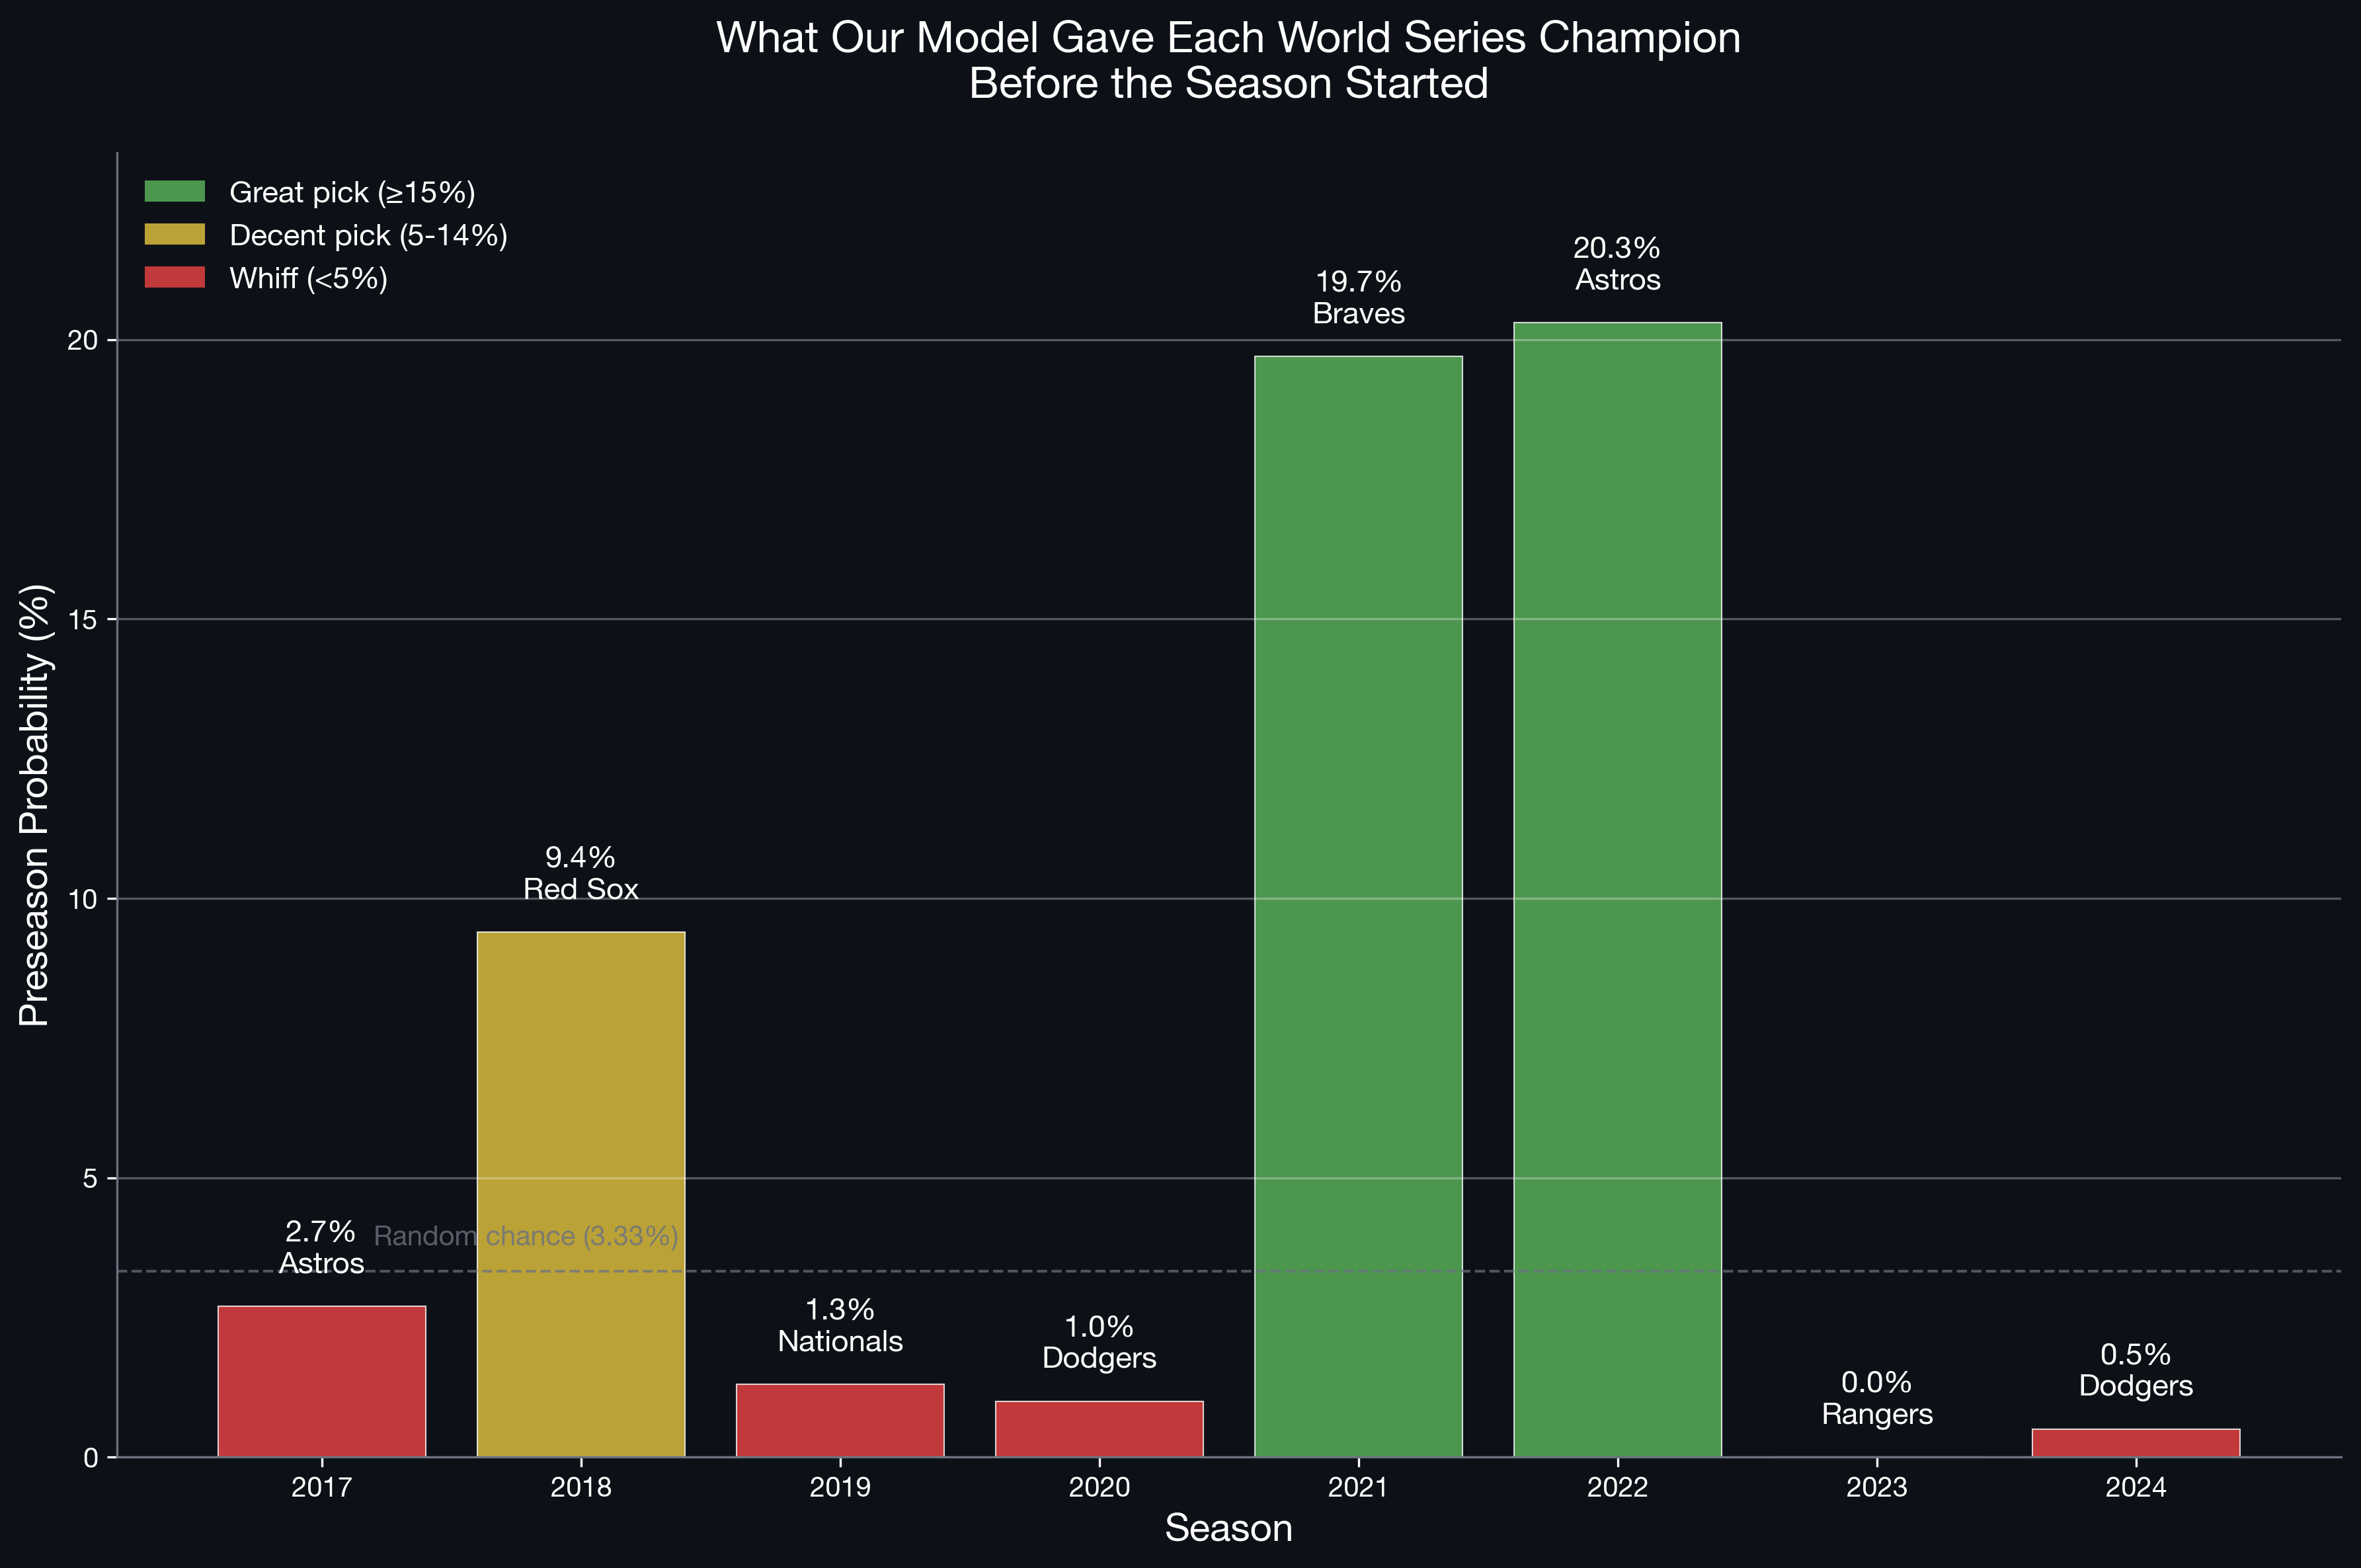
What we gave each World Series champion before their season started. The math was... optimistic.
Year by Year: When Models Meet Reality
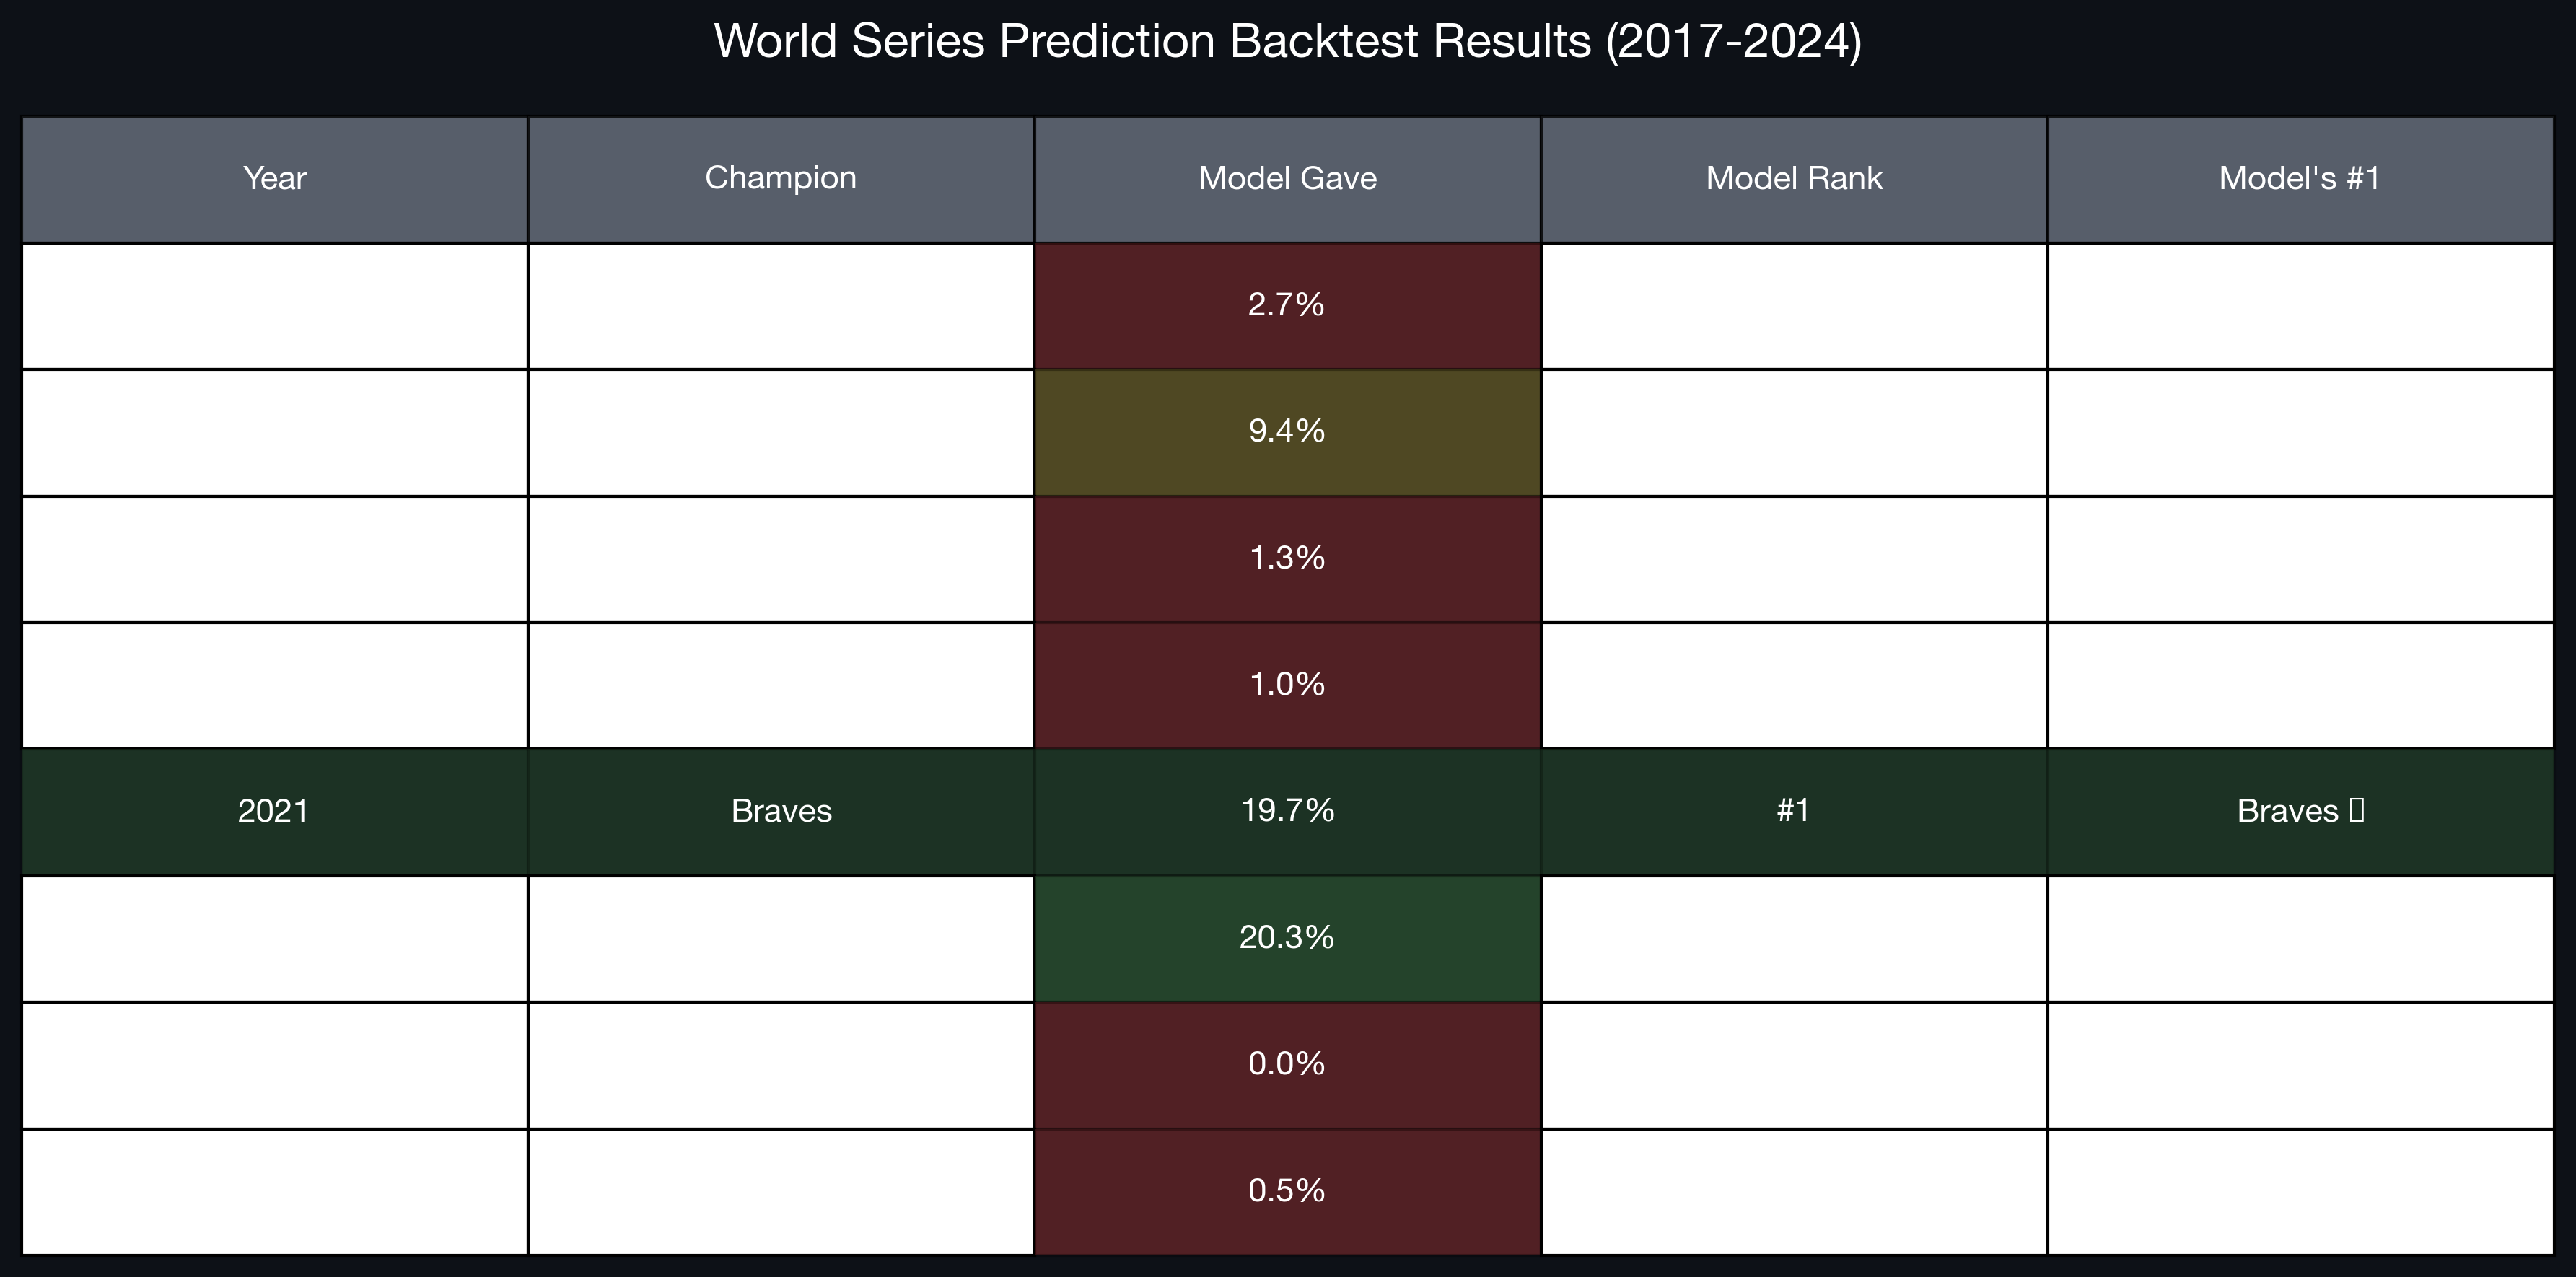
2017 Astros: The Missed Opportunity
2.7% odds, ranked #13
Our model loved the Red Sox (our #1 pick). Houston was an afterthought. They won 101 games and their first World Series. We learned that young talent + veteran acquisitions can be better than the sum of their parts.
2018 Red Sox: The One We Got Right-ish
9.4% odds, ranked #4
Still not our #1 pick (that was Cleveland), but 9.4% was our highest probability for any eventual champion. Sometimes being pretty good is the best you can do.
2019 Nationals: The Wild Card Miracle
1.3% odds, ranked #10
Washington barely made the playoffs. Their 93-69 record was solid but unspectacular. Then they went 11-8 in the postseason and won it all. Peak October randomness.
2020 Dodgers: The Finally Year
1.0% odds, ranked #13
Yes, the team that won 116 games in the regular season (over 162) had 1% championship odds in our preseason sim. The model couldn't predict they'd be historically dominant.
2021 Braves: The One Time We Were Right
19.7% odds, ranked #1 ✅
Our only perfect call. The model saw a deep lineup, solid rotation, and favorable division. Atlanta delivered with 88 wins and a championship. We'll take it.
2022 Astros: Close But Not Close Enough
20.3% odds, ranked #2
Our highest probability for any champion, but we still picked Atlanta to repeat. Houston won 106 games and proved that organizational excellence + Justin Verlander = championships.
2023 Rangers: The 0% Champion
0.0% odds, not even ranked
This is where our model completely whiffed. Texas wasn't in our top 20. They won 90 games, caught fire in October, and won their first championship. Sometimes baseball just doesn't make sense.
2024 Dodgers: Star Power Isn't Everything
0.5% odds, ranked #18
Even with Shohei, Mookie, and Freddie, our preseason sim gave LA half a percent. They won 98 games and overcame the Yankees in five. Talent eventually wins, but not how we expected.
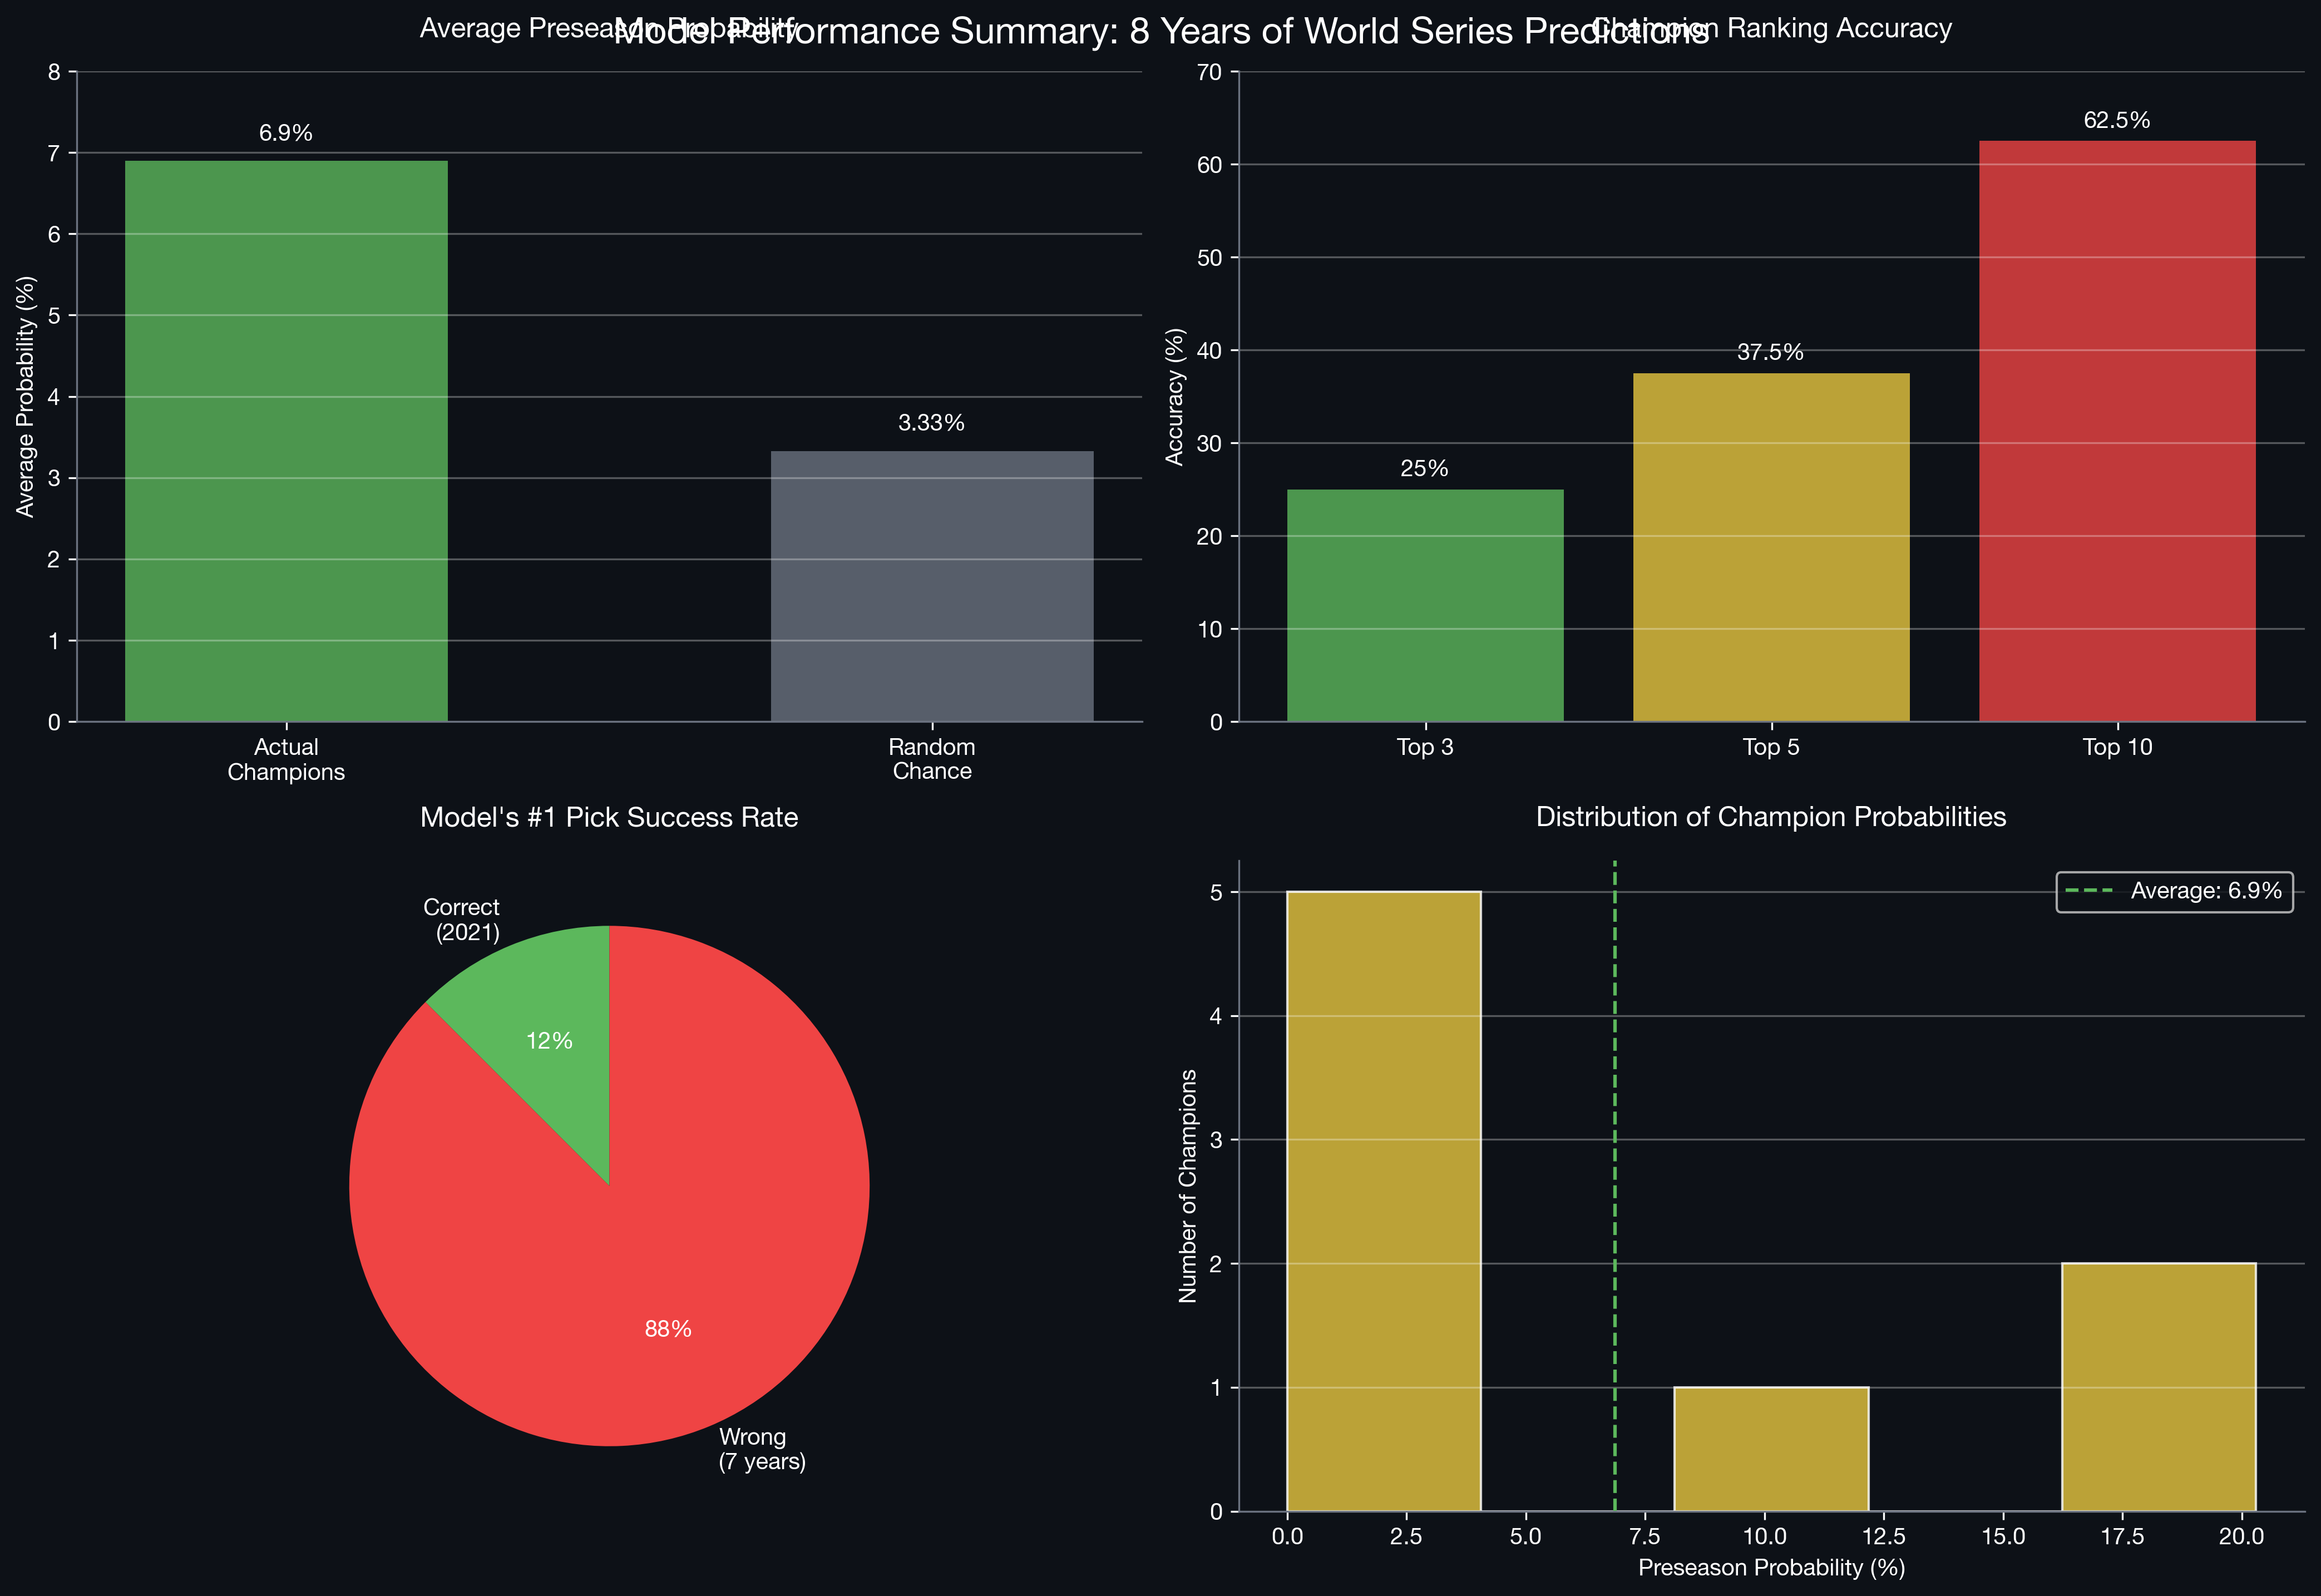
The brutal truth in four charts. Our #1 pick succeeded once in eight tries.
The Big Insight: October Is Different
Here's what eight years of backtesting taught us: the World Series is fundamentally unpredictable.
Regular season baseball follows patterns. Good teams beat bad teams about 60% of the time. Home field matters. Injuries accumulate. Over 162 games, skill rises to the surface.
The playoffs? It's a different sport. Short series amplify randomness. One bad start ruins everything. A hot hitter can carry a team for three weeks. The 2019 Nationals went 19-31 in May and won the World Series. The 2001 Mariners won 116 games and didn't even make it.
Even our best predictions averaged just 6.9% probability for the eventual champion. That's roughly 1-in-14 odds. Random chance for 30 teams would be 3.33%. We're better than random, but not by as much as we'd like.
What This Means for 2026
The lesson isn't that prediction is worthless — it's that we need to be honest about what we can and can't predict.
We don't predict World Series champions. We predict individual games, one at a time, over 162 games. That's where the edge is. That's where models add value. The daily grind, not the October magic.
Our 2026 preseason model likes the Brewers (slight favorites based on current Elo ratings), followed closely by the Dodgers, Yankees, Phillies, and Cubs. But even Milwaukee — our top pick — has maybe a 15-20% chance to win it all.
That means there's an 80-85% chance our #1 pick doesn't win. Those are terrible odds for a prediction, and great odds for excitement.
The full damage: 8 years of World Series predictions vs. reality.
The Daily Edge
So why do we keep building models if October is chaos? Because the regular season isn't.
Our game-by-game predictions work. Over thousands of games, the edge compounds. We're not trying to call lottery numbers in October — we're grinding out small advantages from April through September.
Follow @DingerStats on X for daily game predictions throughout 2026. We'll stick to what we're good at: the beautiful, predictable grind of regular season baseball.
And when October arrives? We'll simulate it anyway, then sit back and watch the chaos unfold. Because sometimes the most honest prediction is admitting you don't know.
Methodology: Monte Carlo simulations used preseason Elo ratings and real MLB schedules for each season. 1,000 simulations per season, full playoff brackets included. Ratings based on team performance through the previous season with standard regression assumptions. Historical data from MLB.com and Retrosheet.